Home/Retail Franchises
Retail Franchise Opportunities
Retail franchises span a wide range of concepts, from convenience stores and specialty shops to consumer products and services. While retail faces unique challenges from e-commerce competition, franchise systems with strong brand loyalty and unique in-store experiences continue to thrive.
§ Drawn from 84 retail FDDs on file · latest filings
What 84 filings say
The category, read from the documents.
Not estimates — every figure below is aggregated from the disclosure documents themselves.
Total initial investment · distribution
Where 84 disclosed ranges land. Median $373,000.
The $300–500K band holds the median filing. The middle half of these brands sit between $237,000 and $536,000.
70%
disclose an Item 19
59 of 84 brands on file, against 74% across every brand in the database.
103
median U.S. unit count
Across the 83 brands that disclose an outlet count in their latest filing.
6%
median royalty
Across the 80 brands that state a single rate; the rest tie royalties to sales tiers or charge none.
+0.8%
median outlet change, 2025 to 2026
Across the 41 brands that filed in both years: 23 grew, 11 shrank.
Figures are drawn straight from each brand’s latest FDD. See our franchise industry reports for the trends behind these numbers.
Retail Franchise Brands
Showing 13 of 84 retail franchises with a published breakdown. Search all retail brands →
FDD 2025–2026
Total investment
$162K–$1.7M
U.S. units
8,303
Royalty
Varies (see Item 6)
Item 19
Not disclosed
FDD 2025–2026
Total investment
$611K–$2.1M
U.S. units
5,250
Royalty
No royalty fee
Item 19
Disclosed
FDD 2025
Total investment
$852K–$1.6M
U.S. units
4,053
Royalty
Varies (see Item 6)
Item 19
Not disclosed
FDD 2026
Total investment
$43K–$557K
U.S. units
2,361
Royalty
Varies (see Item 6)
Item 19
Disclosed
Past the table
Every number above has a page it comes from.
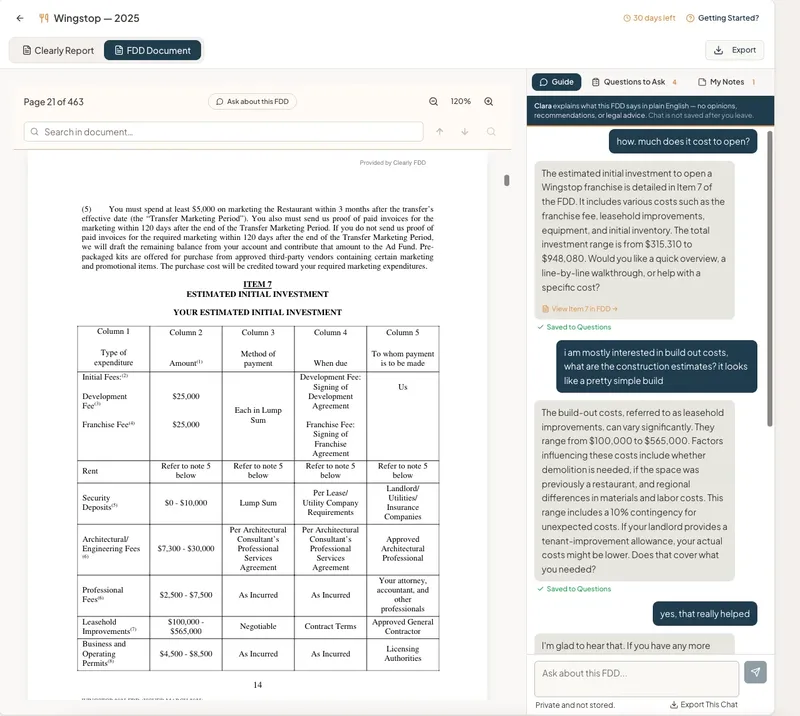
A Workspace opens the brand’s actual FDD next to its Clearly Report — every figure cited to the Item and page, questions answered from this filing only, and both years side by side when the brand has filed twice.
See a Workspace →